For comments and questions regarding IR, please contact us through the "Contact Us" section of this website.
Please note that we do not accept inquiries by telephone. Please understand that we do not accept inquiries by phone.


|
sales
Operating income
Ordinary income
Profit attributable to owners of parent
sales
Operating income
Ordinary income
Profit attributable to owners of parent
|
|
ROA(%)
ROE(%)
|
|||||||||||||||||||||||||||||||||||||||||||||||||||||||||||||||||||||||||||
|
Capital adequacy ratio(%)
Net worth (Millions of JPYen)
|
|||||||||||||||||||||||||||||||||||||||||||||||||||||||||||||||||||||||||||
|
Cash Flow (Millions of JPYen)
|
|||||||||||||||||||||||||||||||||||||||||||||||||||||||||||||||||||||||||||
|
dividend per share (JPYen)
* From 23/6 onwards, the dividend per share is after the stock is divided into three parts. |
|||||||||||||||||||||||||||||||||||||||||||||||||||||||||||||||||||||||||||
|
Sales by Region(Millions of JPYen)
Percentage of sales by region
|
|||||||||||||||||||||||||||||||||||||||||||||||||||||||||||||||||||||||||||
|
Property, plant and equipment by region(Millions of JPYen)
Property, plant and equipment by region
|

| Total number of authorized shares | 38,812,800 shares |
||||||||||||||||||||||||||||||||||||
|---|---|---|---|---|---|---|---|---|---|---|---|---|---|---|---|---|---|---|---|---|---|---|---|---|---|---|---|---|---|---|---|---|---|---|---|---|---|
| Total number of issued shares | 17,930,693 shares |
||||||||||||||||||||||||||||||||||||
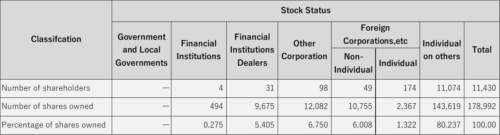
| number of shareholders | 13,040 |
||||||||||||||||||||||||||||||||||||
| Major shareholders (Top 10) |
※Shareholding ratio is calculated after deducting treasury stock (82,522 shares). |
||||||||||||||||||||||||||||||||||||
| Stock distribution by owner |
|
||||||||||||||||||||||||||||||||||||
| Fiscal year | April 1st to March 31th |
||||||||||||||||||||||||||||||||||||
| Ordinary General Meeting of Shareholders | Within 3 months from the day following the last day of each fiscal year |
||||||||||||||||||||||||||||||||||||
| Listed stock exchange | Tokyo Stock Exchange Standard “Securities Code 3856” |
||||||||||||||||||||||||||||||||||||
| Reference date | March 31th |
||||||||||||||||||||||||||||||||||||
| Record date for distribution of surplus | March 31th, September 30st |
||||||||||||||||||||||||||||||||||||
| Number of shares in one trading unit | 100 shares |
||||||||||||||||||||||||||||||||||||
| Shareholder registry administrator | Mizuho Trust & Banking Co., Ltd. 1-2-1 Yaesu, Chuo-ku, Tokyo |
||||||||||||||||||||||||||||||||||||
| Public notice publication method | Our public notice method is electronic public notice. |
||||||||||||||||||||||||||||||||||||
| Benefits for shareholders | Not applicable. |


Our company philosophy states that we will continue to contribute to the sustainable development of society by striving to improve social life through value creation focusing on the provision of advanced products, operations, and services, and that we will continue to improve and maximize employee happiness, win-win relationships with our clients and society, and corporate value and shareholder value, based on our vision of becoming an “Excellent Creative Company.” We have established the following disclosure policy in order to implement timely, accurate, and fair information disclosure to shareholders, investors, and other stakeholders according to appropriate standards, methods, and systems based on these principles. With the policy in place, we will strive to help our stakeholders further deepen their understanding of our businesses, management strategies, operating results, management goals, and more.
The Company discloses information in accordance with the Companies Act, the Financial Instruments and Exchange Act, and other laws and regulations, as well as the “Regulations for Timely Disclosure of Corporate Information” (hereinafter referred to as “Timely Disclosure Rules”) stipulated in the “Securities Listing Regulations” of the Tokyo Stock Exchange.
When information regarding decisions, occurrences, and financial results that have a significant impact on investment decisions arises, we will promptly disclose said information in accordance with the standards of the Timely Disclosure Rules, and even if it does not fall under the Timely Disclosure Rules, we will proactively disclose information that we deem important or useful in order for stakeholders to deepen their understanding of the Company, as well as information that we believe will be useful in making investment decisions.
We will not disclose personal information, customer information, or any information that might infringe on the rights of related parties.
Information required by the Timely Disclosure Rules and laws and regulations will be promptly disclosed in accordance with prescribed disclosure procedures, such as announcements on TDNet (a timely disclosure network provided by the Tokyo Stock Exchange), and thereafter promptly posted on our website.
The Company has established internal regulations for the purpose of appropriately managing important company information, preventing insider trading, and implementing fair information disclosure, and we are promoting the thorough dissemination, understanding, and awareness of these regulations amongst the executives and employees of all group companies.
Amongst the earnings forecasts, forward-looking statements, strategies, targets, etc. disclosed by the Company, statements other than those regarding past or current facts are forward-looking statements that reflect plans, expectations, and judgments based on information currently available to the Company and certain assumptions that the Company determines reasonable. Actual results and other data may differ from the disclosed earnings forecasts, etc. due to various risks and uncertainties.
In order to prevent the leakage of financial results information (including quarterly financial results information) and ensure the fairness of information disclosure, the Company observes a quiet period from the day after the end of the financial period (quarterly financial period) to the date of each financial results announcement. During the quiet period, we refrain from answering questions or commenting on financial results. However, even during the quiet period, if it becomes necessary to make changes to the earnings forecast due to changes in the economic situation or market environment, we will disclose information in accordance with the Timely Disclosure Rules.
Although we take great care when posting information on the IR information webpage of our website, we do not guarantee the accuracy of the content. The IR information webpage is a supplementary means for information requiring disclosure under the Companies Act, Financial Instruments and Exchange Act, other laws and regulations, and the Timely Disclosure Rules, and we ask that you also take a look at disclosures under the Companies Act that are disclosed in accordance with these laws and regulations, disclosures under the Financial Instruments and Exchange Act such as securities reports, the Tokyo Stock Exchange’s TDNet, and more.
The Company and its officers and employees are not responsible for any damage caused by the use of information posted on the IR information webpage or other online information about the Company. Moreover, please note that the information on our IR webpage may be changed without prior notice.
Currently, we are carefully considering how to respond to malicious defamatory posts and baseless, inappropriate posts concerning us and our officers and employees on internet message boards and similar platforms, in consultation with our legal counsel. Depending on future developments, we will conduct a fair investigation and take strict actions as necessary.
It is regrettable that some of these posts may potentially violate the Financial Instruments and Exchange Act’s prohibition on market manipulation or the dissemination of false rumors and may also constitute illegal actions that damage our reputation.
If we determine that certain acts are malicious and illegal, we will take firm and decisive measures, including preserving evidence, requesting disclosure of sender information, and pursuing legal remedies. We ask for your understanding in this matter.